West Seattle Crime Watch: May property-crime statistics

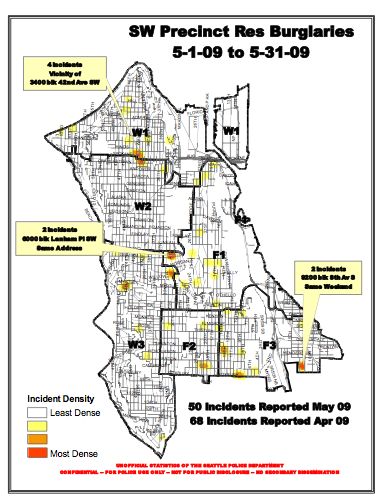
Earlier this week, we linked to the official Seattle Police release of crime statistics from the first 4 months of this year. Since then, we’ve learned the Southwest Precinct compiles even more specific – and fresher – reports each month, and Lt. Steve Paulsen has just shared the West Seattle-area “property crimes” report for May. The map above, showing where residential burglaries happened last month, is just one part of it. The entire document is a PowerPoint you can see here in its entirety (we converted it to a PDF) – or, just read the highlights: Last month in West Seattle, there were 100 car prowls, almost the same as April (101), but significantly up compared to 74 in May 2008; as for auto thefts, last month there were 32, up from 29 in April and 28 in May 2008. (Notably, though, June through May, the auto-theft totals are down from the same period a year earlier: 503 for June ’07 through May ’08, 417 for June ’08 through May ’09.) Residential burglaries are down: 50 during May, compared to 68 in April, and 56 in May 2008. Lots of numbers but if you prefer to see all the charts and maps for yourself – it’s all here.

9 Replies to "West Seattle Crime Watch: May property-crime statistics"

  • marco June 5, 2009 (1:28 pm)

    “highlights”?? ;)

    Why does it say “UNOFFICIAL STATISTICS OF THE SEATTLE POLICE DEPARTMENT CONFIDENTIAL — FOR POLICE USE ONLY — NOT FOR PUBLIC DISCLOSURE — NO SECONDARY DISSEMINATION”in the PDF?

  • WSB June 5, 2009 (1:42 pm)

    Not quite sure but trust me, this was given to us explicitly for sharing purposes. May have been a template thing.

  • eastonterrier June 5, 2009 (1:45 pm)

    This report isn’t entirely accurate. Specifically, it doesn’t include the car prowl that occurred in front of my house the last week of May, which was reported to the police. Based on that ommission, I’m guessing the stats are actually worse than the police report portrays.

  • Kathy June 5, 2009 (1:49 pm)

    It also does include my son’s car’s break in the last week of May which was reported to SPD.

  • WSB June 5, 2009 (1:49 pm)

    I will check with Lt. P. but I don’t know that the dots are supposed to be marking EVERY incident – if you notice the density designations – could be (again, I’ll check) that if there was not MORE than one in a specific location, it didn’t get a shading … checking … TR

  • Sage June 5, 2009 (1:56 pm)

    Thanks WSB for converting this to PDF. It’s the little things…

  • MSU June 7, 2009 (9:27 am)

    A more accurate map detail that California uses, if Seattle police chooses to use it, is crimemapping.com. Using that tool, hover the cursor over the incident dot and it gives specifics of date, crime, status, etc. Many police departments don’t like to give that level of detail because of political reasons though.

  • MAP June 7, 2009 (9:03 pm)

    There are a number of car prowls not listed in this report. Our neighborhood had at least 3 prowls on one night in the beginning of April that were reported to the police and do not appear on the map.

  • alki_2008 June 7, 2009 (10:33 pm)

    MAP – I believe the maps are for May incidents, and notes just the TOTAL for April as comparison. The dots are for May incidents, so if your’s was in April…then it wouldn’t have a dot on the map.

Sorry, comment time is over.